
Updated on 16 Apr 2026
In the last web performance explained article, we learned about the metrics we can capture to measure a website’s performance.
This involved looking at the difference between quantity and milestone metrics, before moving on to explore some widely used examples of the latter, such as Time to First Byte, First Paint, First Meaningful Paint, Speed Index and Time To Interactive.
In this article, we’ll take the next logical step and learn about the tools we can use to capture these metrics. We’ll focus on two of the most popular and widely used: Google Lighthouse and WebPageTest.
Google Lighthouse
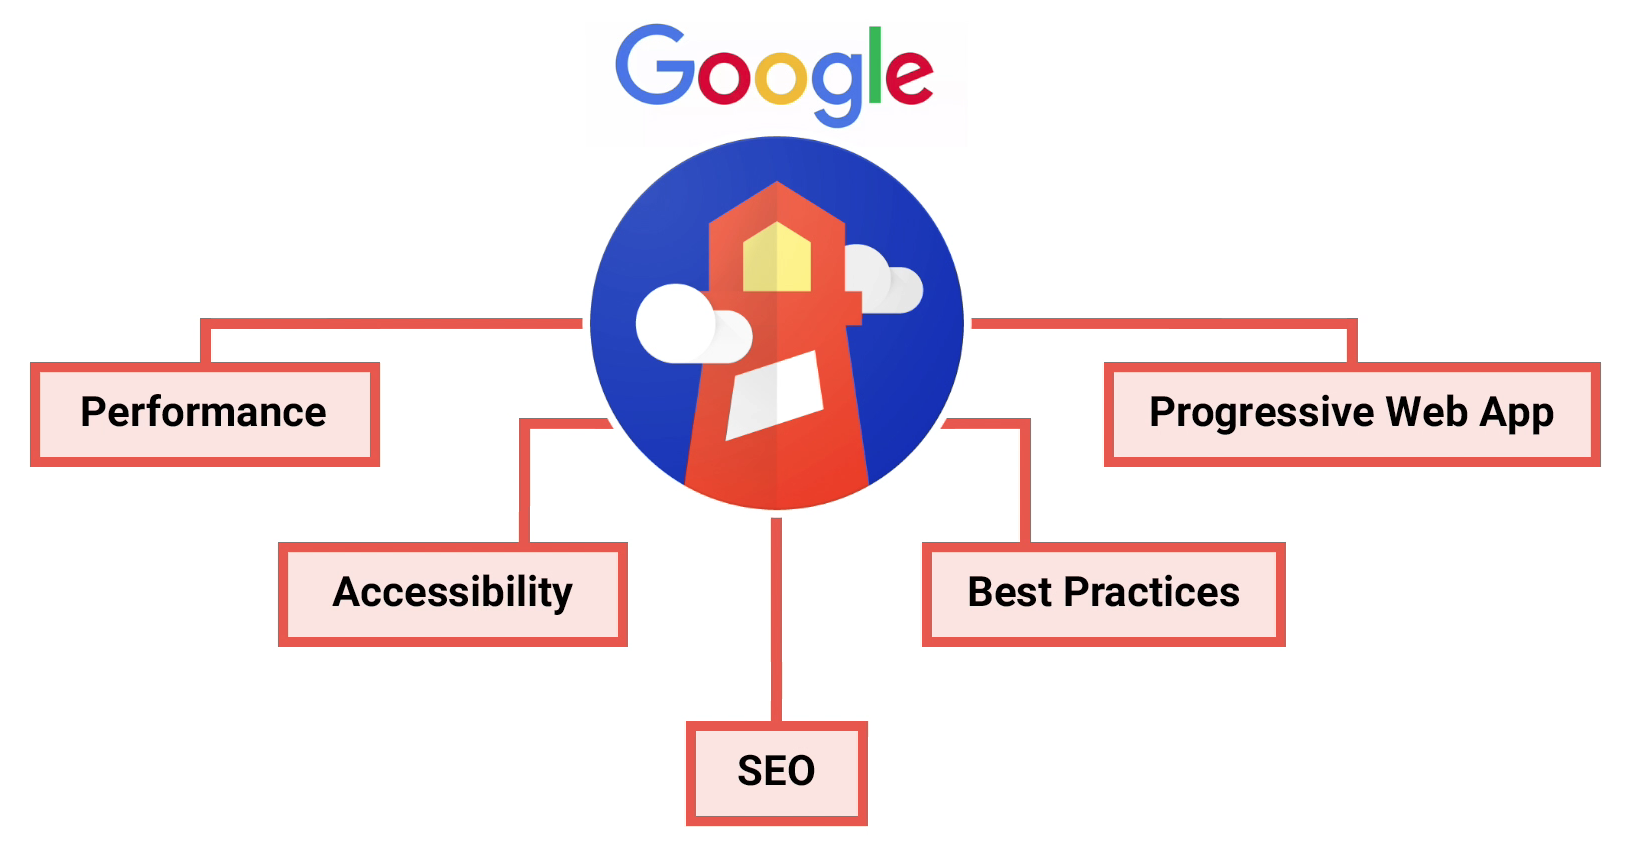
Lighthouse is a web performance tool created by Google. It allows a developer to quickly measure the performance of a website. Lighthouse does this by running audits in a number of areas, which together form an overall picture of its web performance. These areas are:
- Performance
- Accessibility
- Search Engine Optimisation (SEO)
- Adherence to best practices
- Progressive web app implementation
Following these audits, the data Lighthouse collects is then used to generate a report. Here’s an example:
As you can see, for each area of the report, an aggregate score between 0-100 is generated based on the recorded metrics.
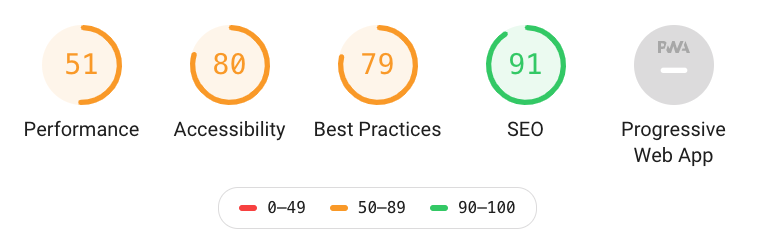
This is really useful because it improves the accessibility of the data for non-technical readers.
For instance, Gary from marketing may not understand what his website’s Speed Index or First Contentful Paint metrics represent, but with a performance score of 51, he knows that they likely need work, so can raise this accordingly with the devs.
And speaking of devs, for each area, there is more technical information available.
First off, we have web performance metrics like First Contentful Paint and Speed Index which were covered in the previous Web Performance Explained article.
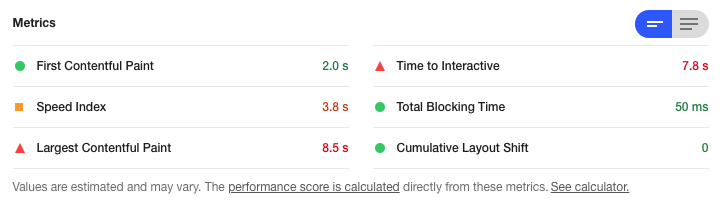
A Lighthouse report also contains information on which audits your website has passed, and most importantly, for the audits which didn’t pass, information and recommendations are given on how the website could do things better.
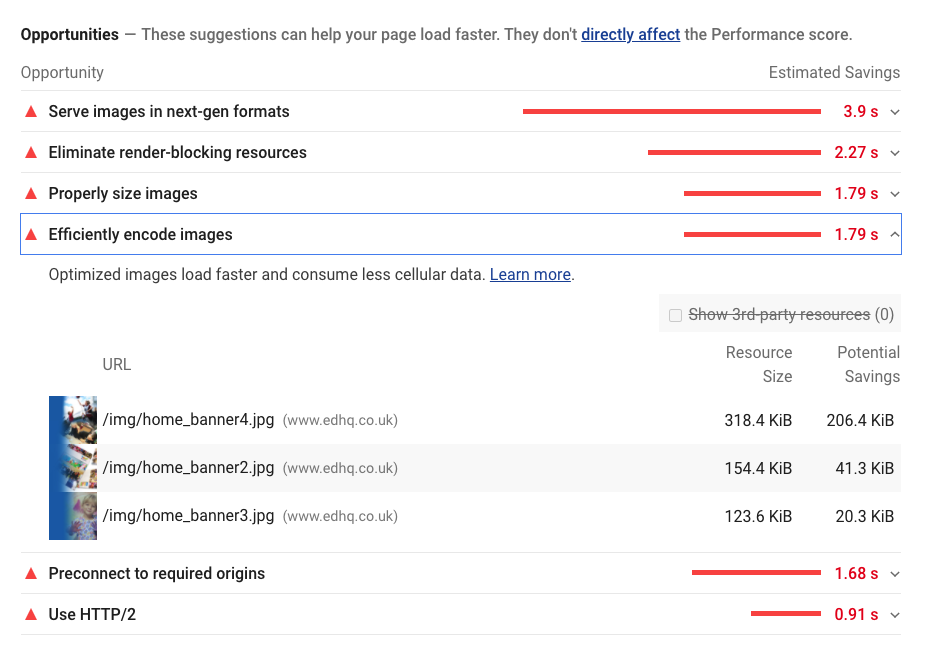
For example, in the screenshot below, Lighthouse estimates that 1.79s could be trimmed from the overall load time if some of the website’s more weighty images were reduced in file size through more efficient encoding.
There’s lots of different ways you can run a Lighthouse report.
Devtools
One of the most common is directly through devtools using either Chrome or Edge. You can find this under the audits panel.
In this instance, because the tests are running on your own machine, rather than on one of Google’s own servers, conditions are not always the same between tests, which could lead to skewed datasets.
For this reason, I recommend using devtools Lighthouse more for rough ballpark auditing; a confirmation that your performance optimisations are working, rather than for long term performance monitoring.
PageSpeed Insights
You can also run lighthouse audits on the web via Google’s Pagespeed Insights.
In addition to the standard Lighthouse metrics, which is controlled lab data, for larger websites with more visitors, PageSpeed Insights provides field data sourced from the Chrome User Experience Report. This is a big data service providing metrics for how fast other Chrome users are loading the website.
In this example, we can see that on mobile, for the first contentful paint metric, 30% of loads see a fast paint, 62% of loads see a moderate one, whilst 8% see a pretty slow one.
The 1.8s value represents the 75th percentile for the metric, which means this is the First contentful paint seen by users during the slowest 25% of observed page loads over the past 30 days.
Other ways
Lighthouse can also be accessed via Google Analytics, or for more advanced usage, in the command line or programmatically via the Lighthouse Node.js module.
WebPageTest
WebPageTest is a synthetic testing tool used to measure the performance of a website and capture a ton of lab data.
Originally developed in 2008 by Patrick Meenan at AOL, it has since evolved into an active open source project with 150 contributors and over 2,500 github stars.
It can be run on any environment of your choosing, but is most widely used via its free, public instance at webpagetest.org, which as of September 2015, runs around 45,000 tests per day with a total of 53 million since it first launched.
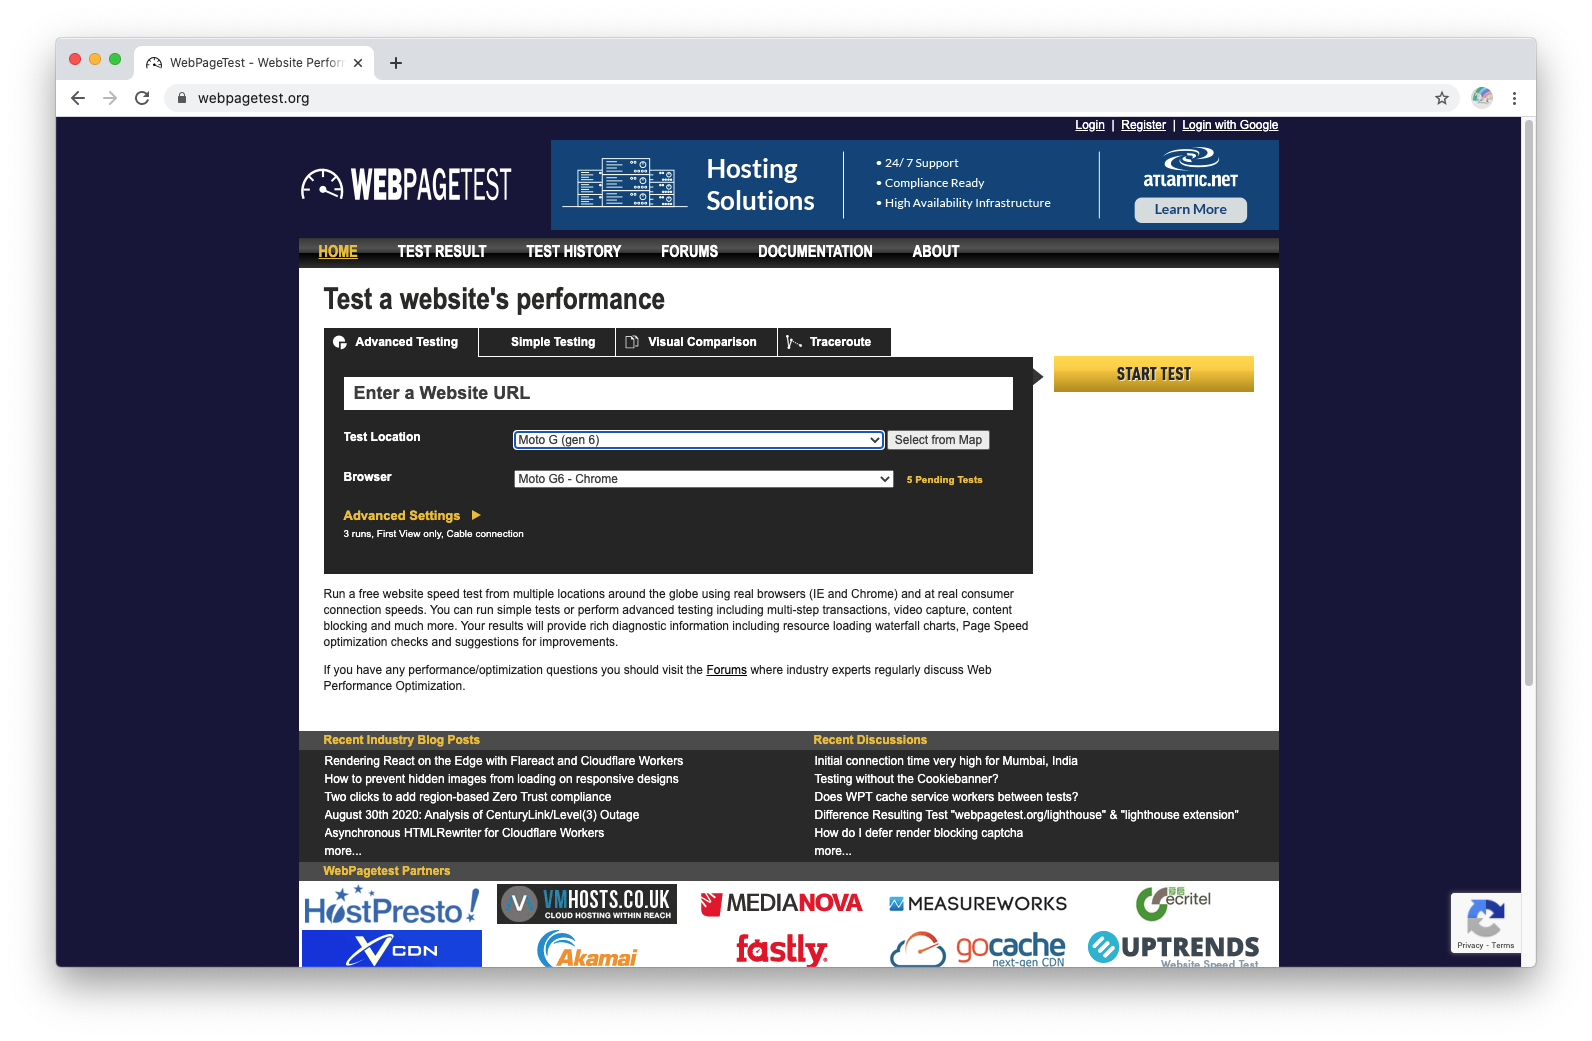
It doesn’t look like much at first glance, but it’s a powerful tool which can be very useful once you get over its steep learning curve.
The first thing I would recommend is that you register an account. This makes it much easier to access all of your tests and even compare results afterwards.
Now with that out of the way, let’s configure a test.
Test configuration tips
Compared to Google Lighthouse, WebPageTest is definitely more a developer focused tool. As such, there’s a bucket load of options which you can configure on your tests, many of which you may use on every test, others you may never touch at all.
Here are a few tips I’d recommend when configuring your own tests.
Number of tests to run
Set this to a high number like 5. This way, by running multiple tests under the same conditions, you’ll be able to establish what is consistently good and what’s consistently bad.
Bulk Testing
When you’ve registered an account, adding ?bulk=1 to the end of the web address like https://www.webpagetest.org/?bulk=1 will enable an extra option called 'Bulk Testing'. This allows you to automate the testing of multiple web addresses one after the other, which can be especially helpful when running comparisons with competitors for example.
Repeat View
When running tests, make sure 'First View and Repeat View' is selected.
First view simulates how the website performs when somebody visits it for the first time, whilst repeat view tests how the website performs when the same user comes back – accounting for cache, service workers and other browser niceties which impact load times.
Test Location
WebPageTest lets you test using different device types and network conditions from across the world. On the web, the further the user is geographically from the website’s host server, the longer it will take to load.
When testing your own website, make sure to take this into consideration. For example, if you’re a UK based business targeting UK based customers only, there’s no point in testing how the website performs when accessed in Australia.
Test results
To put it simply, a typical WebPageTest audit captures a ton of data in its report. Here’s a flying tour:-
You can also access the WebPageTest report yourself, as each one has its own permalink.
Here are some of the more widely used features of a WebPageTest report:
Generate images and videos of your website loading
Often I’ve found that it can be difficult to communicate the severity of performance problems with non-technical stakeholders because the numbers involved are often small.
For instance, an 8 second loading time may not sound like much, but in web performance land, it’s far from it.
In a previous Web Performance Explained article, we learned how good web performance can improve UX.
As page load times grow, so does the probability of the user leaving immediately (AKA bounce):
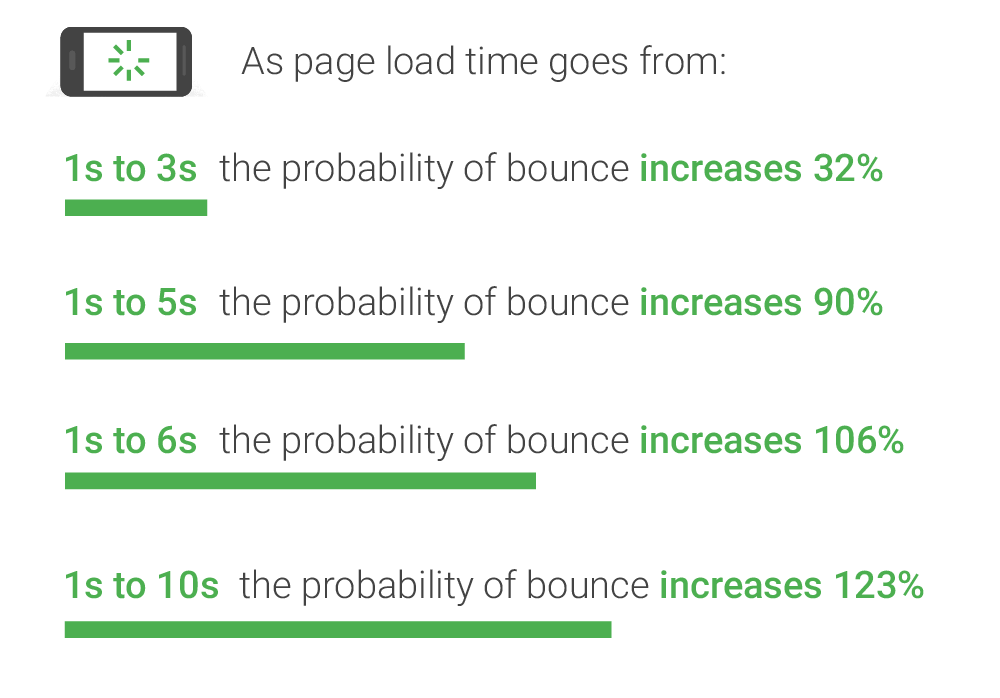
Therefore, rather than telling stakeholders about bad web performance, show them what it looks like.
WebPageTest makes this easy, as it records the website loading as part of the audit. Look out for the 'Watch Video' links in the report to access this functionality.
Waterfall charts
This is a waterfall chart generated by WebPageTest. There’s a lot of information to process here, but it’s one of - if not the - most important part of the web performance report because it visualises the website’s network activity.
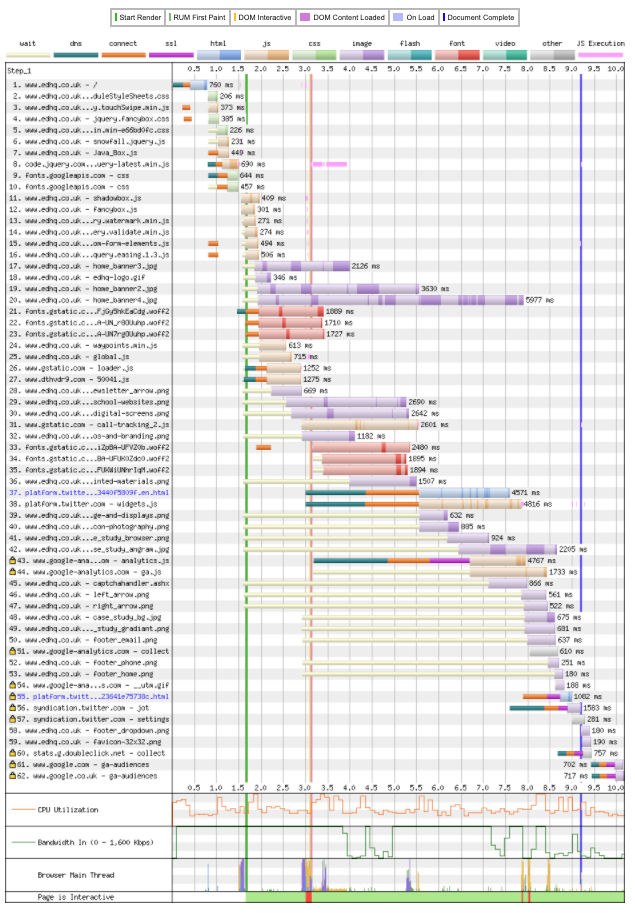
Using this you can identify many things, including:
- Resources which take too long to load
- Resources which block the rendering of the website
- 3rd party resources which if slow or broken will severely impact the loading of the website (These are known as single point of failure requests, aka: SPoF)
- How well HTTP2 is being utilized to load many resources simultaneously.
- Identify poor 3rd party resources with servers that are slow to respond (Leading to slow Time to First Byte / TTFB metrics).
Compare old vs new to test performance improvements
As you make code changes and compress static assets, you’ll want to run a new WebPageTest audit and see how its report differs from the previous one. WebPageTest makes this kind of comparison easy through its compare reports functionality.
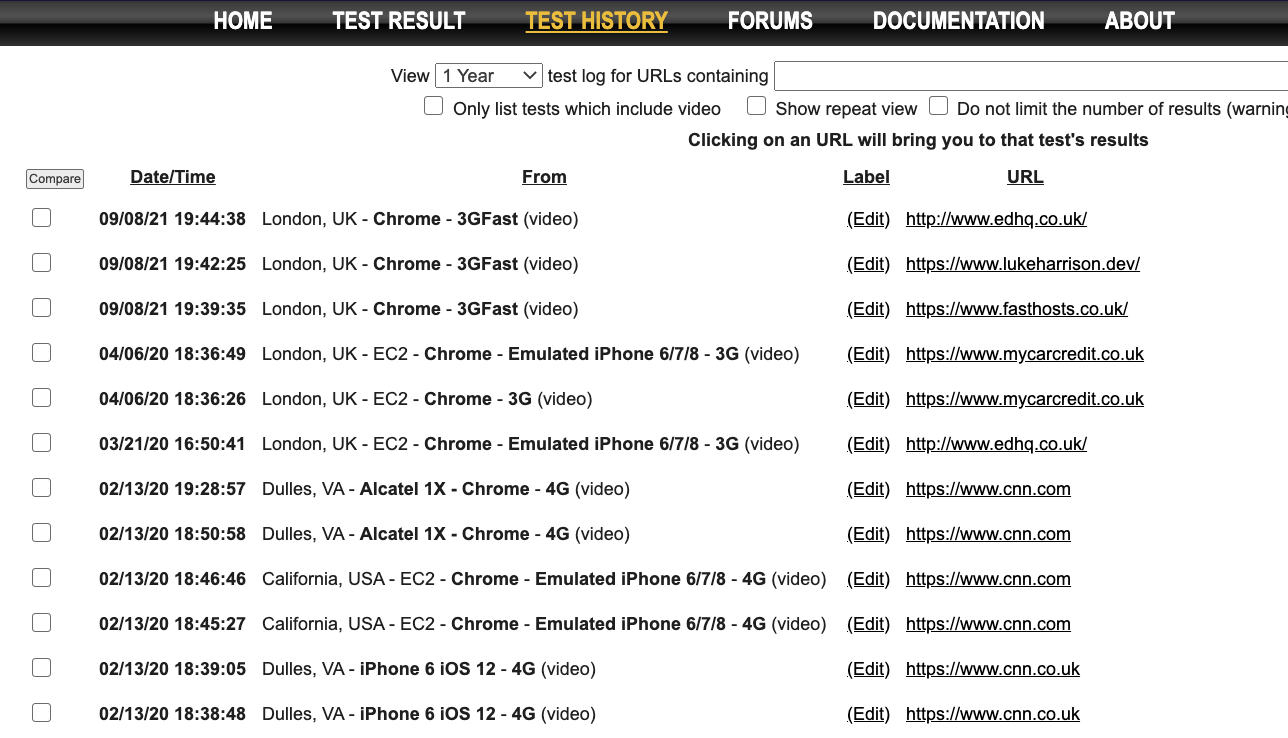
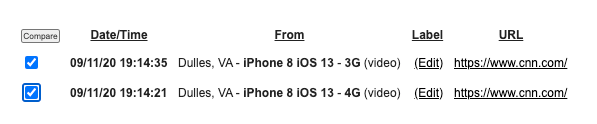
In this example, I’ve generated two reports for cnn.com, one using 4G and the other 3G, to simulate a difference in performance.
Click test history, then find your two reports, select them both and click compare.
Here’s the comparison link, where you have a number of ways to compare the two reports:
- Compare the loading of both reports in filmstrip view, which you can then export as an image to easily share with stakeholders. The example below shows the 3G load first, followed by the 4G load. The difference in performance is clear.

- You can generate a video comparison, which again is very useful when trying to communicate web performance problems with non-technical stakeholders. Show beats tell every time.
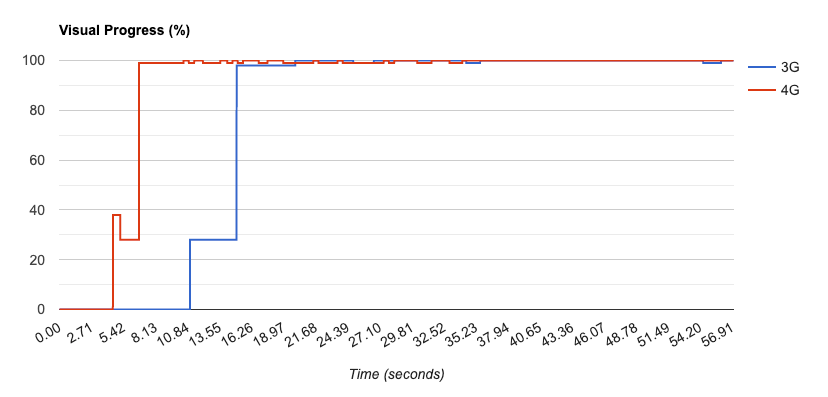
- Finally, there’s the hard data, which is useful for developers in identifying more subtle differences between reports. Below is an example of one graph from this section, which compares the rate of visual completion.
Summary
When testing the performance of a website, knowing what tools to use and how best to use them is important.
Start with Google Lighthouse, which is the more accessible tool. Once you’re comfortable analysing it’s reports, then have a go at WebPageTest.
Due to the amount of information you’re presented with, WebPageTest can be overwhelming at first. However, once you’re over its admittedly steep learning curve, you’ll come to see it as a very powerful tool which will help you measure and then improve the performance of your website.
If it's time to take your site to the next level, take a look at our Web Hosting solutions, or range of super powerful Cloud Servers.